Adding Microseconds to vRealize Operations Graphs

In my old role as a vSphere administrator for a single company, we upgraded our storage from legacy spinning disk with a small amount of cache. This environment often experienced disk latency greater than 3ms on average and often time much higher than that, getting up to 20ms or higher for 30 seconds at a time, over a thousand times a day. We upgraded to a hybrid array with results of less than a millisecond latency for read and write operations…consistently.

vCenter Performance

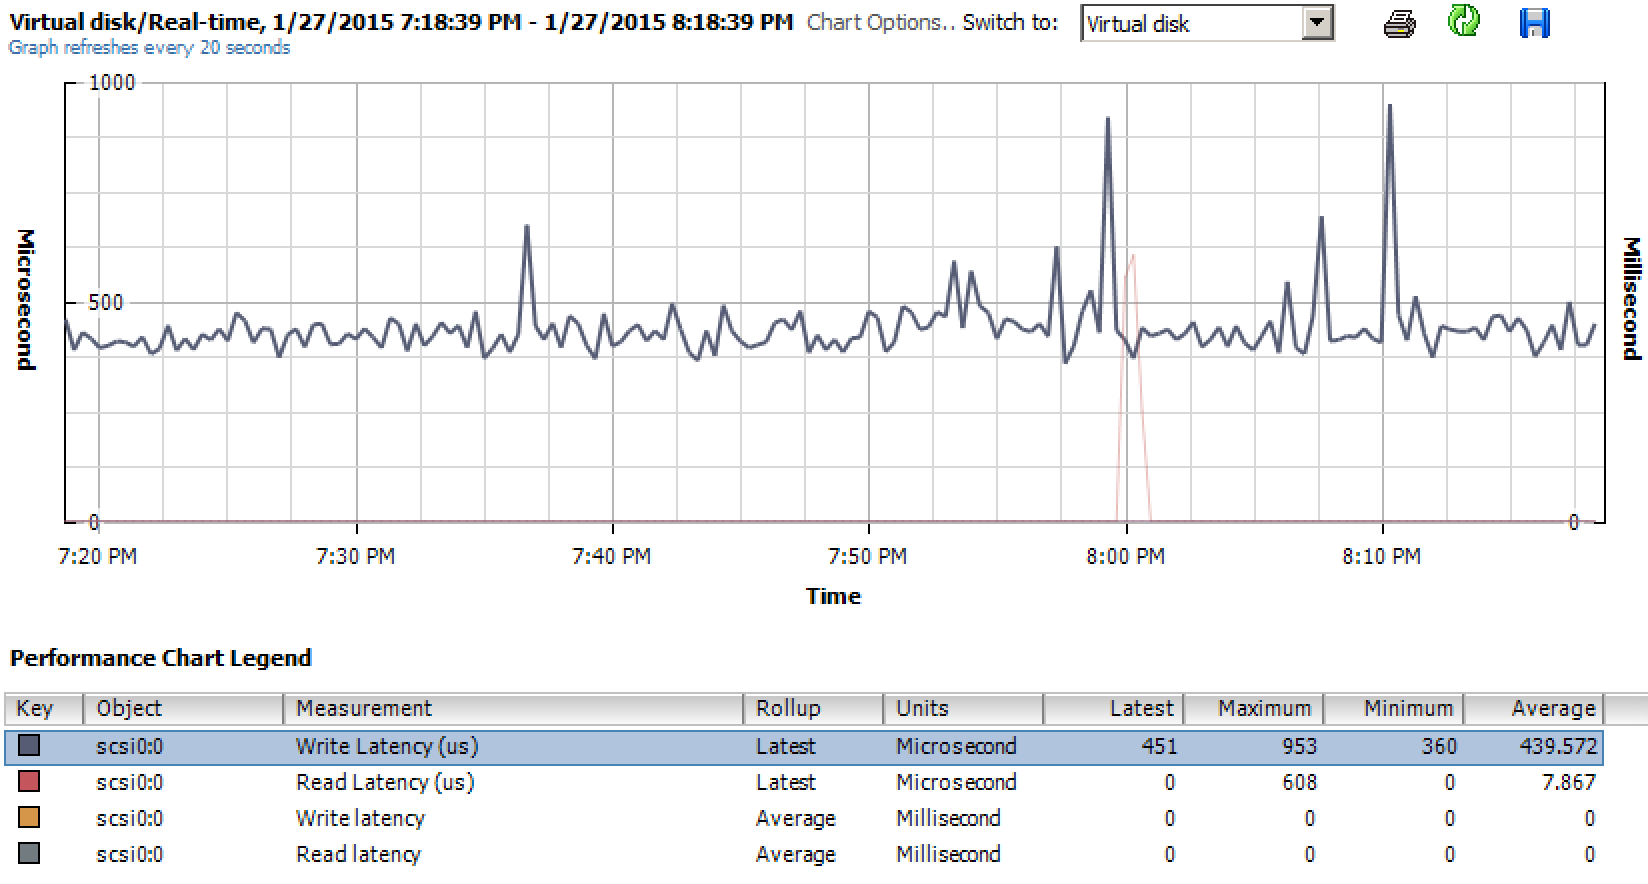
We tracked this with vCenter as well as vCenter Operations Manager. In vCenter, it’s tracked on a per virtual machine instance. We could monitor this by using the vCenter performance tab on a virtual machine and selecting Virtual Disk and monitoring the read and write latency numbers for both Milliseconds and Microseconds, as seen below.

Monitoring in vCenter was great, but it’s only available for live data, or the last hour. That doesn’t help in seeing history. We fixed this by looking into vCenter Ops and in our installation, the numbers were there. Great…history. We can now use this latency number as justification for our new storage selection.

Fast forward to my current role, as a consultant. I recently installed vRealize Operations Manager for a customer. One of the reasons was to monitor disk performance as they evaluated new storage platforms for their virtual desktop environment. As I looked into vCenter, the counters were there, but when I looked into vRealize Ops the counter wasn’t available. What gives?

After contacting my previous coworker, we compared configurations and neither one of us could figure it out. I already had a case open with VMware regarding the vRealize Ops install for an unrelated issue. On a recent call with VMware support, we compared these two vCenter/vRealize Operations manager environments. It really stumped the support engineer as well. After about five minutes, we figured it out. When vCenter Operations Manager was installed, the selection to gather all metrics was selected. vRealize Operations Manager doesn’t give you this options. Instead you need to change the policy.

Here’s How:
Log into vRealize Operations Manager, select a VM, and select the troubleshooting tab. Take a note of the policy that is effect for the VM…if you haven’t tweaked with vROPs, then the policy will be the same for all objects.

vRealize Policy

Click on this policy, this will link to the administration portion of vROPs focused on the “Policies” section.

vRealize Policy List

Click on the “Policy Library” tab. Drop down the “Base Setting” group, and select the proper policy that was at the top of the virtual machine troubleshooting tab. Then click not the edit pencil.

vRealize Operations Edit Policy

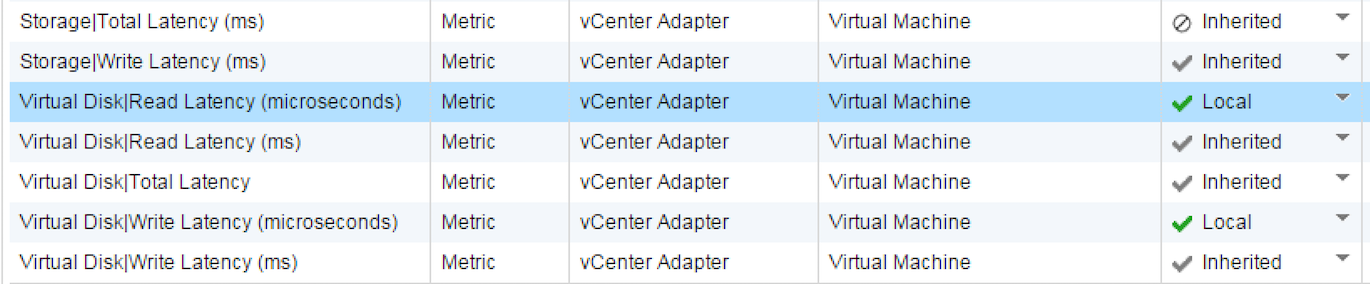
Once in the “Edit Monitoring Policy” window (shown below), limit the Object type to “Virtual Machine” and filter on “Latency”. This will reduce the object to a single page.

vRealize Override Attributes

Change the “state” for the Virtual Disk|Read Latency (microseconds) and Virtual Disk|Write Latency (microseconds) to “Local” with a green checkmark.

vRealize Operations Attribute Changes

After about 5 minutes, verify that the data is now displayed in vRealize Ops.

vRealize Operations Graph


Why is this counter important?
As SSD arrays like Pure Storage and XtremIO or hybrid arrays like Tintri become more prevalent, millisecond latency numbers are near 0 and result in a single flat line and no real data, but microseconds really allows administrators to see any changes in latency that would otherwise be flattened out.

I’d like to thank El Gwhoppo for allowing me to guest author. I hope this tidbit is useful information!

How to delete the vsanDatastore for VMware Virtual SAN

There are a lot of blog posts on how to set up the cool new Virtual SAN, but not a lot on how to destroy the Virtual SAN object. Probably because it’s really simple. Never fear! In a shameless effort to drive hits from google, here is your step by step on how to delete the vsanDatastore.

Deleting the vsanDatastore means that all the data on the underlying disk groups will be nuked. Gone. Vamoosed. This means you must either migrate the VMs to separate available local storate or to another storage solution. You can delete a disk group from one of the nodes, then reformat the disks into VMFS volumes, but you will obviously lose fault tolerance when you move to that. But hey, you’re the one deleting the virtual SAN object, not me. You should know why you’re doing it and what you’re moving to. I had to do this because I needed to nuke and refresh my cluster on 5.5. U1 from the beta refresh.

1. Migrate all the VMs and templates elsewhere. Where that is, well that is your problem. You can verify if there are any objects remaining by examining the related datastore object here.
Step12. Turn off HA on the Virtual SAN enabled cluster. You’ll need this to be off to turn off the Virtual SAN feature.
Step2
3. Delete all the disk groups individually. We will get warned that we should put it in maintenance mode first if we’re performing maintenance, but since we’re nuking the sucker we don’t want to do that.
Step3
3. We can see the local disks become available in the add storage wizard for each host as we delete the disk groups.

step4

4. Repeat the process until all the disk groups have been deleted.
step5
5. We are now ready to turn off the VSAN Feature on the cluster object.

step6

6. Click OK on the warning.

step7

7. Re-enable HA on the cluster. All done!

step8


How to reset administrator@vsphere.local password in vCenter 5.5

  1. Open command prompt as administrator on the SSO 5.5 server
  2. cd /d “C:\Program Files\VMware\Infrastructure\VMware\CIS\vmdird”
  3. vdcadmintool.exe
  4. Press 3 to enter the username
  5. Type: cn=Administrator,cn=users,dc=vSphere,dc=local
  6. Hit enter
  7. New password is displayed on screen
  8. Press 0 to exit

Pretty easy eh?

SSOPW


You can get to the same utility on the VCSA by logging in with root at the console and launching the following command: 

/usr/lib/vmware-vmdir/bin/vdcadmintool

Follow the same process listed above to generate a new password. 

Wireshark Network Capture Any vSwitch Traffic ESXi 5.5

So before ESXi 5.5 if we wanted to perform a packet capture natively from the ESXi box using standard switches we could only use the tcpdump-uw tool, which only allowed us to capture traffic on individual VMkernel ports. Not very useful if there’s a problem on a standard vSwitch that only has virtual machine traffic on it. With dvSwitch, we can do port mirroring and netflow, but that left the sad little standard switch outside in the bitter cold when it came time to troubleshoot non-vmkernel traffic.

Good news space heroes, released with 5.5 is the newly minted pktcap-uw tool which allows you to specify any uplink for packet capture.

For example, to capture 100 packets on on vmnic1 and output it as a pcap file into /tmp:

pktcap-uw –uplink vmnic1 –outfile /tmp/vmnic1cap.pcap -P -c 100

vmnic1

From here we can use a WinSCP or other file transfer to download the pcap file and load it into Wireshark.

pktcap-uw -h yields the help message with all usage options, including source and destination IP/mac filters.

Packet Capture and Trace command usage:
        == Create session to capture packets ==
         pktcap-uw [–capture <capture point> | [–dir <0/1>] [–stage <0/1>]]
            [–switchport <PortID> | –vmk <vmknic> | –uplink <vmnic> |
               –dvfilter <filter name>]
               –lifID <lif id for vdr>]
            [-f [module name.]<function name>]
            [-AFhP] [-p|–port <Socket PORT>]
            [-c|–count <number>] [-s|–snapLen <length>]
            [-o|–outfile <FILE>] [–console]
            [Flow filter options]
        == Create session to trace packets path ==
         pktcap-uw –trace
            [-AFhP] [-p|–port <Socket PORT>]
            [-c|–count <number>] [-s|–snapLen <length>]
            [-o|–outfile <FILE>] [–console]
            [Flow filter options]
The command options:
        -p, –port <Socket PORT>
                Specify the port number of vsocket server.
        -o, –outfile <FILE>
                Specify the file name to dump the packets. If unset,
                output to console by default
        -P, –ng   (only working with ‘-o’)
                Using the pcapng format to dump into the file.
        –console  (by default if without ‘-o’)
                Output the captured packet info to console.
        -s, –snaplen <length>
                Only capture the first <length> packet buffer.
        -c, –count <NUMBER>
                How many count packets to capture.
        -h
                Print this help.
        -A, –availpoints
                List all capture points supported.
        -F
                List all dynamic capture point functions supported.
        –capture <capture point>
                Specify the capture point. Use ‘-A’ to get the list.
                If not specified, will select the capture point
                by –dir and –stage setting
The switch port options:
(for Port, Uplink and Etherswitch related capture points)
        –switchport <port ID>
                Specify the switch port by ID
        –lifID <lif ID>
                Specify the logical interface id of VDR port
        –vmk <vmk NIC>
                Specify the switch port by vmk NIC
        –uplink <vmnic>
                Specify the switch port by vmnic
The capture point auto selection options without –capture:
        –dir <0|1>  (for –switchport, –vmk, –uplink)
                The direction of flow: 0- Rx (Default), 1- Tx
        –stage <0|1>  (for –switchport, –vmk, –uplink, –dvfilter)
                The stage at which to capture: 0- Pre: before, 1- Post:After
The capture point options
        -f [module name.]<function name>
                The function name. The Default module name is ‘vmkernel’.
                (for ‘Dynamic’, ‘IOChain’ and ‘TcpipDispatch’ capture points)
        –dvfilter <filter name>
                Specify the dvfilter name for DVFilter related points
Flow filter options, it will be applied when set:
        –srcmac <xx:xx:xx:xx:xx>
                The Ethernet source MAC address.
        –dstmac <xx:xx:xx:xx:xx>
                The Ethernet destination MAC address.
        –mac <xx:xx:xx:xx:xx>
                The Ethernet MAC address(src or dst).
        –ethtype 0x<ETHTYPE>
                The Ethernet type. HEX format.
        –vlan <VLANID>
                The Ethernet VLAN ID.
        –srcip <x.x.x.x[/<range>]>
                The source IP address.
        –dstip <x.x.x.x[/<range>]>
                The destination IP address.
        –ip <x.x.x.x>
                The IP address(src or dst).
        –proto 0x<IPPROTYPE>
                The IP protocol.
        –srcport <SRCPORT>
                The TCP source port.
        –dstport <DSTPORT>
                The TCP destination port.
        –tcpport <PORT>
                The TCP port(src or dst).
        –vxlan <vxlan id>
                The vxlan id of flow.

For more information, this KB has information.

http://kb.vmware.com/selfservice/microsites/search.do?language=en_US&cmd=displayKC&externalId=1031186